 Hyperlambda

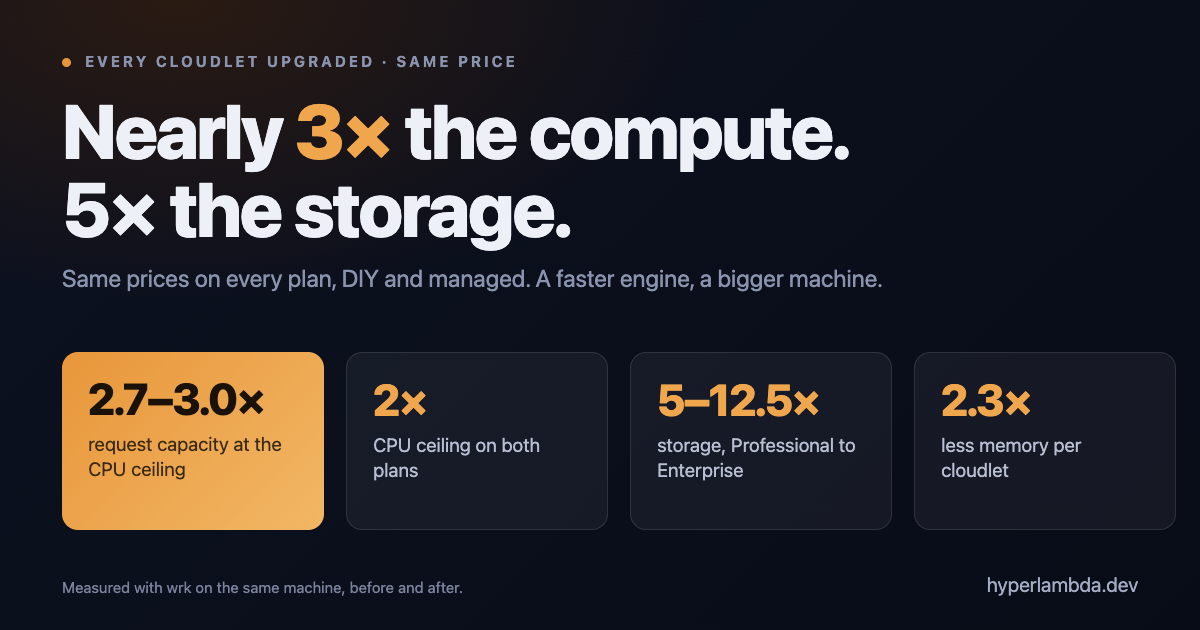
If you run a Magic cloudlet, it just got bigger, and the price did not move. This applies to both of our products: on hyperlambda.dev, where you run your own cloudlet, Professional is still $100 a month and Enterprise is still $300; and if you are on a managed plan from AINIRO at ainiro.io, Professional is still $298 and Enterprise is still $498. Those cloudlets are entirely managed by us, and we create their agents and the rest of what runs on them. They are two different products, and the same bigger machine and faster engine apply to both.
Over the last few days we did two things at once. We rebuilt large parts of the Magic runtime to do more work per CPU core and hold less memory, and we used what that freed up to give every plan a bigger machine. This article is the full list of what changed, with the measurements behind each number.
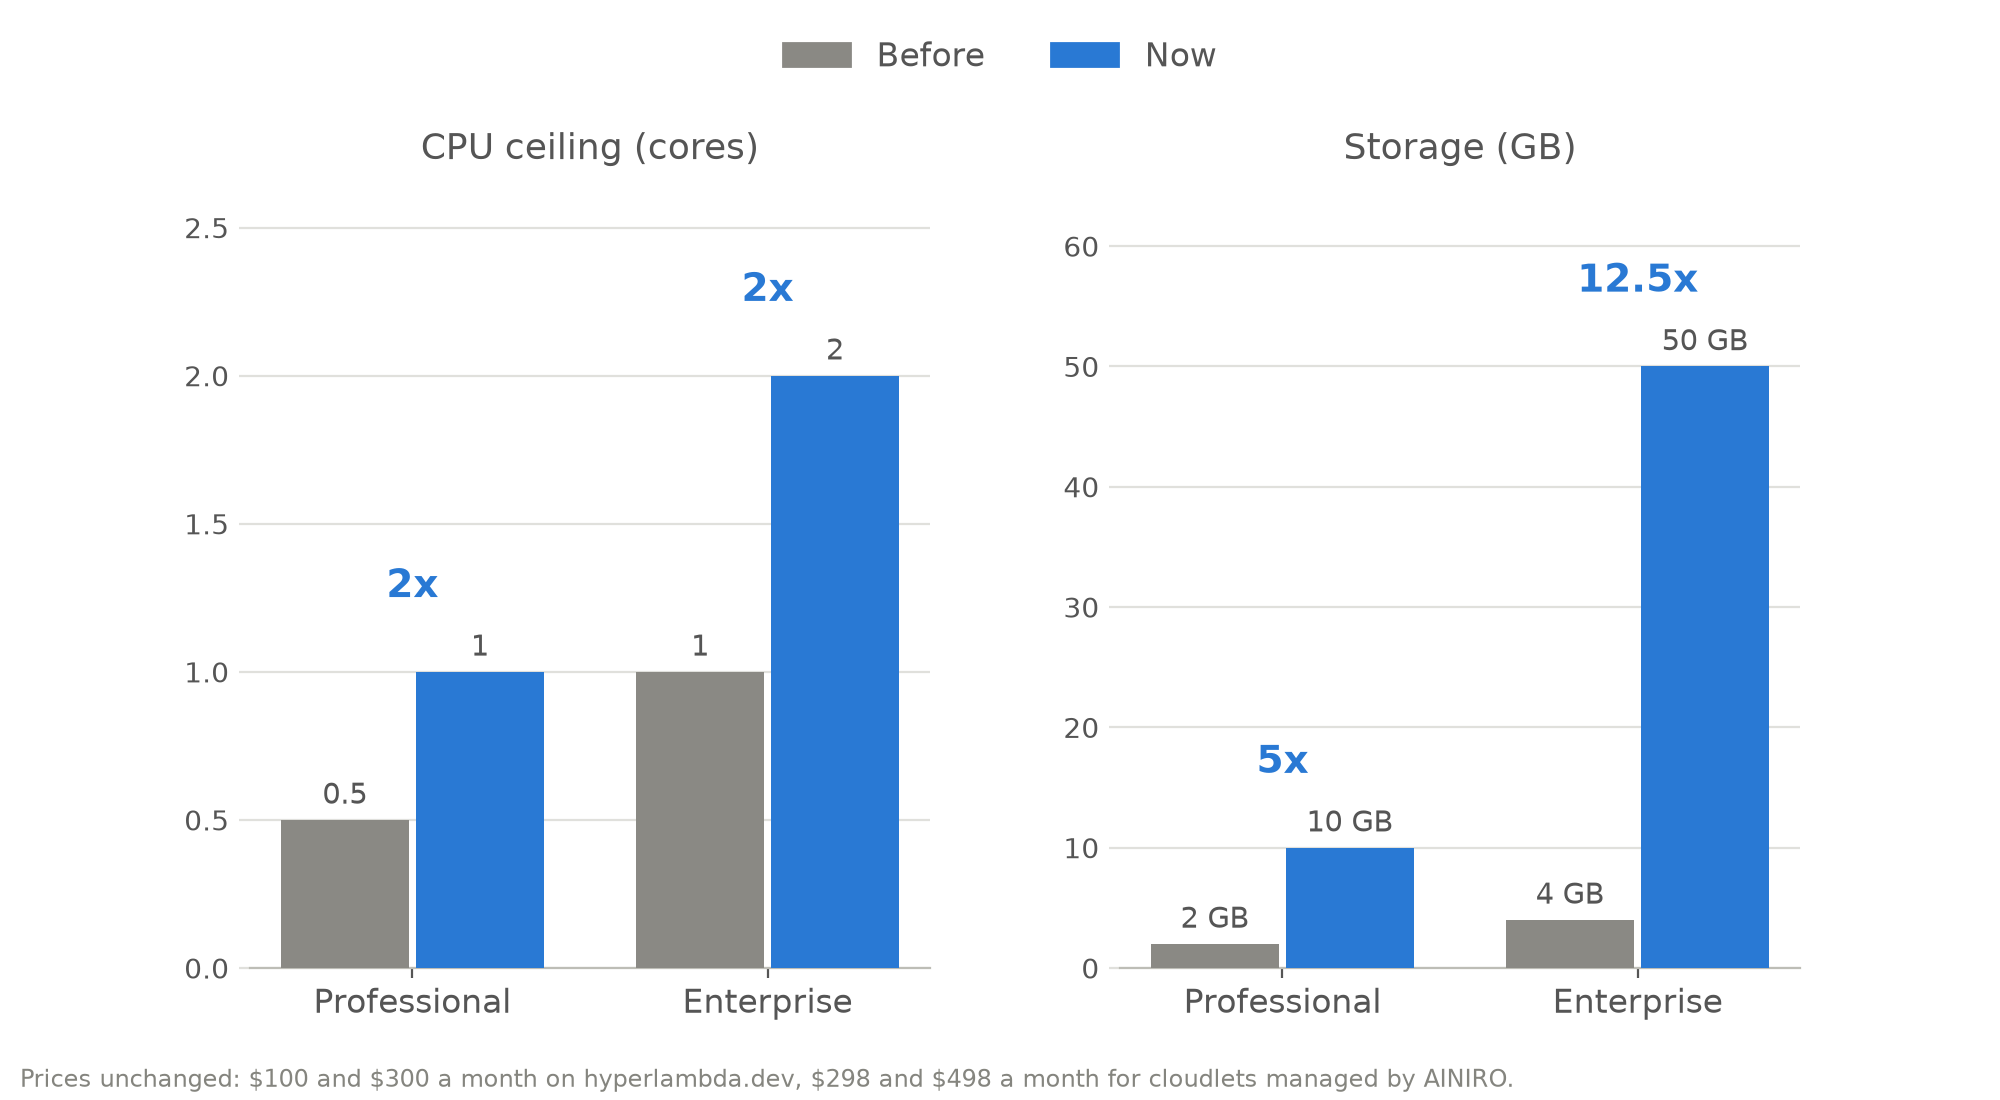
| CPU ceiling | Storage | Memory ceiling | Price, DIY on hyperlambda.dev | Price, managed by AINIRO | |
|---|---|---|---|---|---|
| Professional | 1 core (was 0.5) | 10 GB (was 2 GB) | 768 MB | $100 / month | $298 / month |
| Enterprise | 2 cores (was 1) | 50 GB (was 4 GB) | 2 GB | $300 / month | $498 / month |
That is 2× the CPU ceiling on both plans, 5× the storage on Professional and 12.5× on Enterprise. On top of that, the engine itself now does 1.3× to 1.5× more work per CPU core. Multiply the two and a cloudlet can serve between 2.7× and 3.0× the requests it could before.
The rest of this article is where each of those numbers comes from.
The engine: 1.3× to 1.5× more requests per core
We measured the same Magic backend before and after the optimisation work, on the same machine, with the same configuration and the same three endpoints: a trivial one, one that builds a string, and one that reads ten rows from a pooled SQLite database.
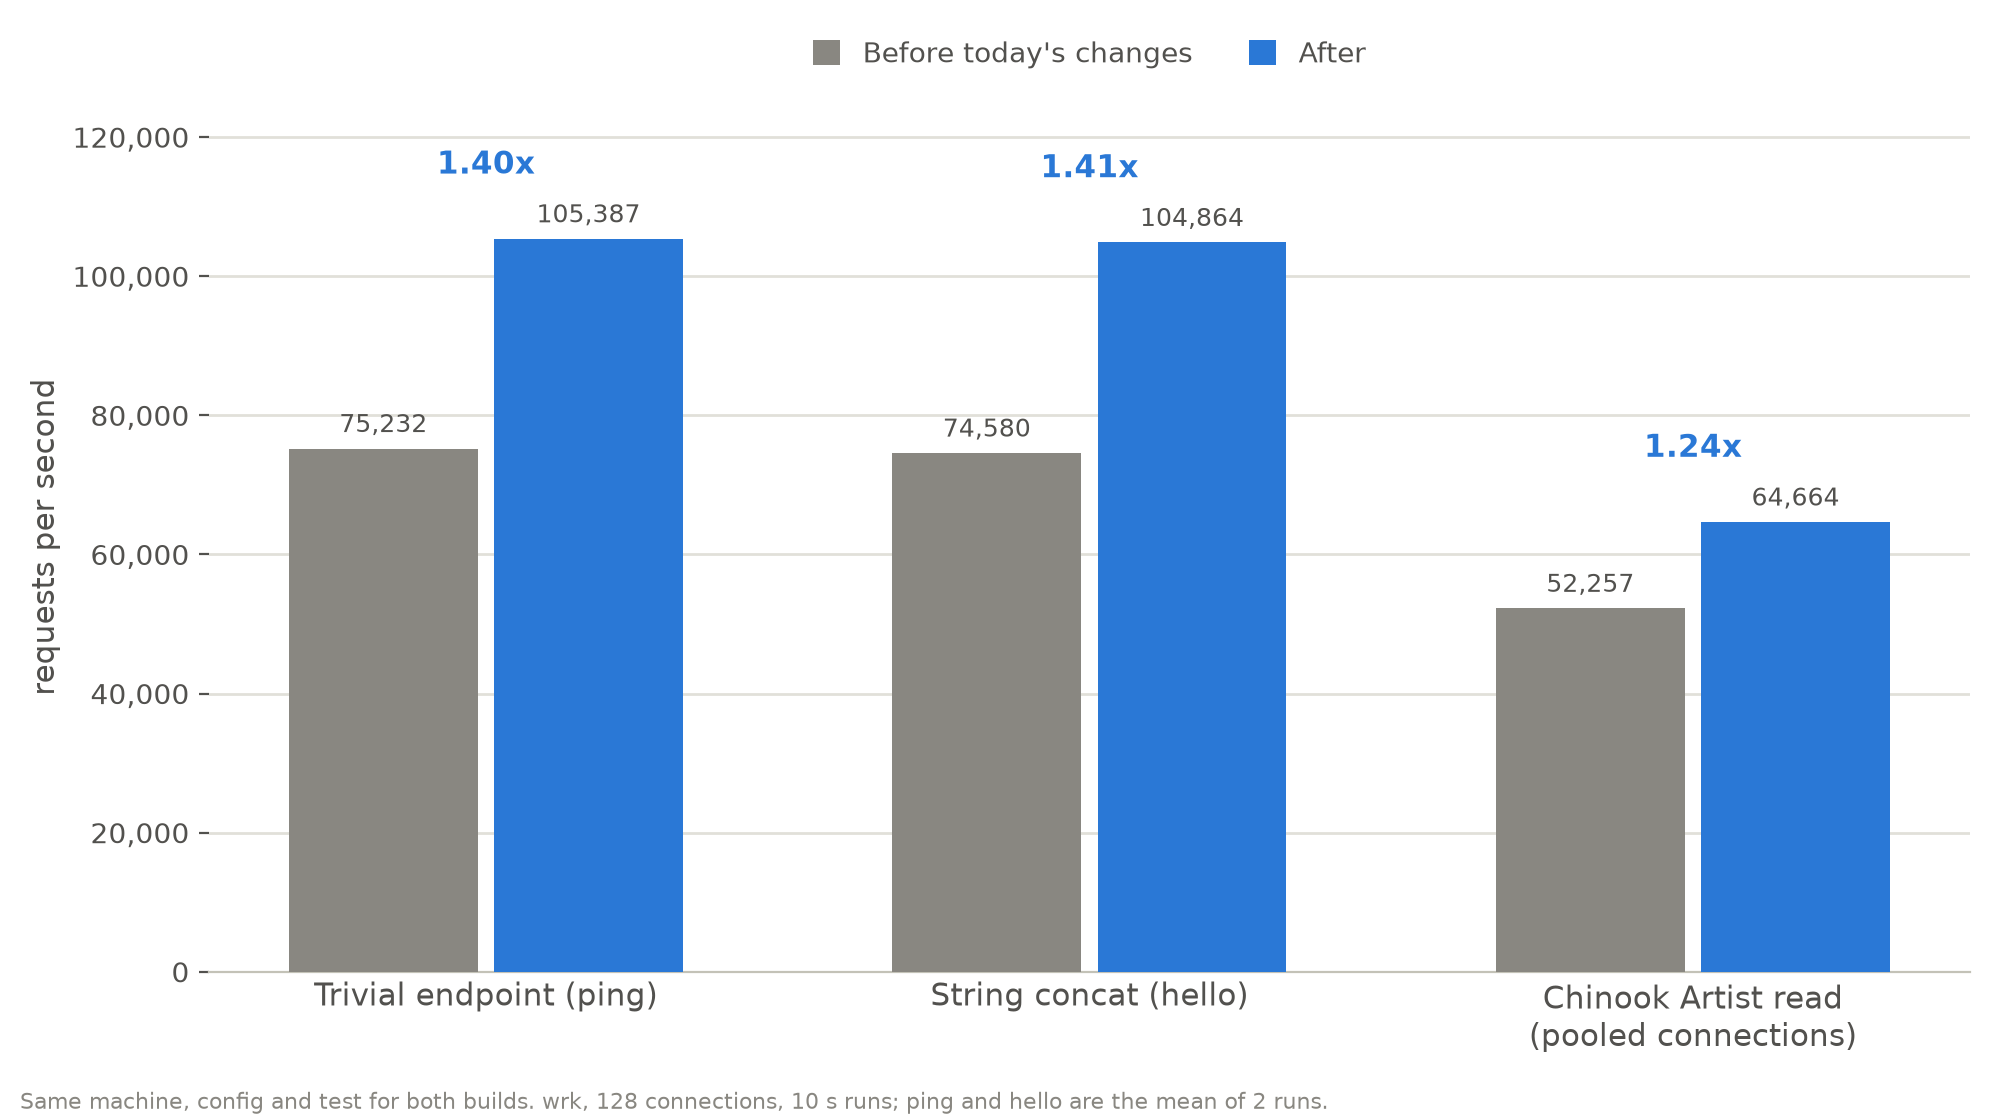
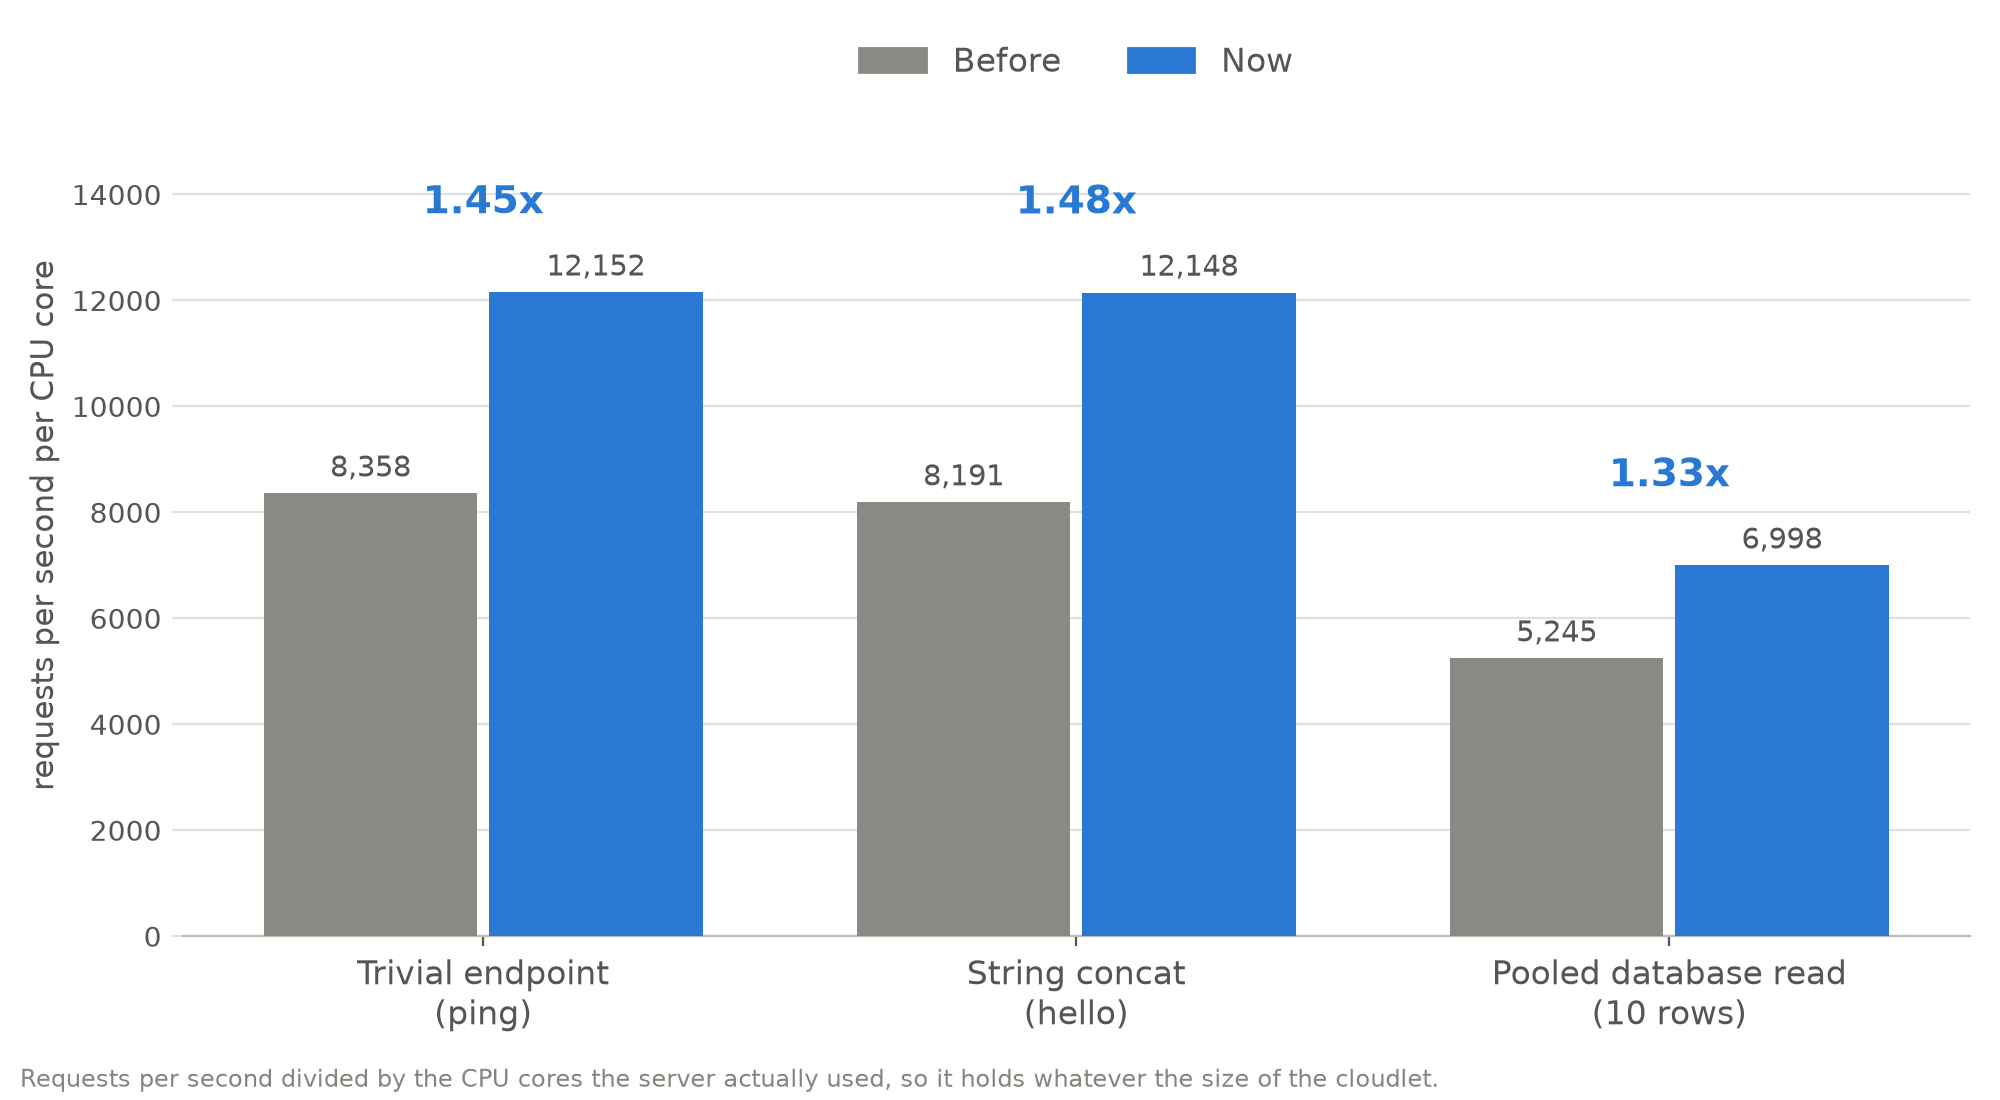
Total throughput went up 1.40× on the trivial endpoint, 1.41× on string building and 1.24× on the database read. We then repeated the whole run from scratch, with fresh builds, and measured CPU use as well:
| Endpoint | Req/s before | Req/s now | CPU cores used before | CPU cores used now | Req/s per core before | Req/s per core now | Gain per core |
|---|---|---|---|---|---|---|---|
Trivial (ping) | 73,061 | 100,118 | 8.74 | 8.24 | 8,358 | 12,152 | 1.45× |
String building (hello) | 71,394 | 99,805 | 8.72 | 8.22 | 8,191 | 12,148 | 1.48× |
| Pooled database read | 47,055 | 62,003 | 8.97 | 8.86 | 5,245 | 6,998 | 1.33× |
Read the CPU columns. The new build serves 32% to 40% more requests while using the same cores or fewer, which is the definition of getting more out of a machine.
Because a cloudlet's CPU ceiling doubled as well, the two gains multiply:
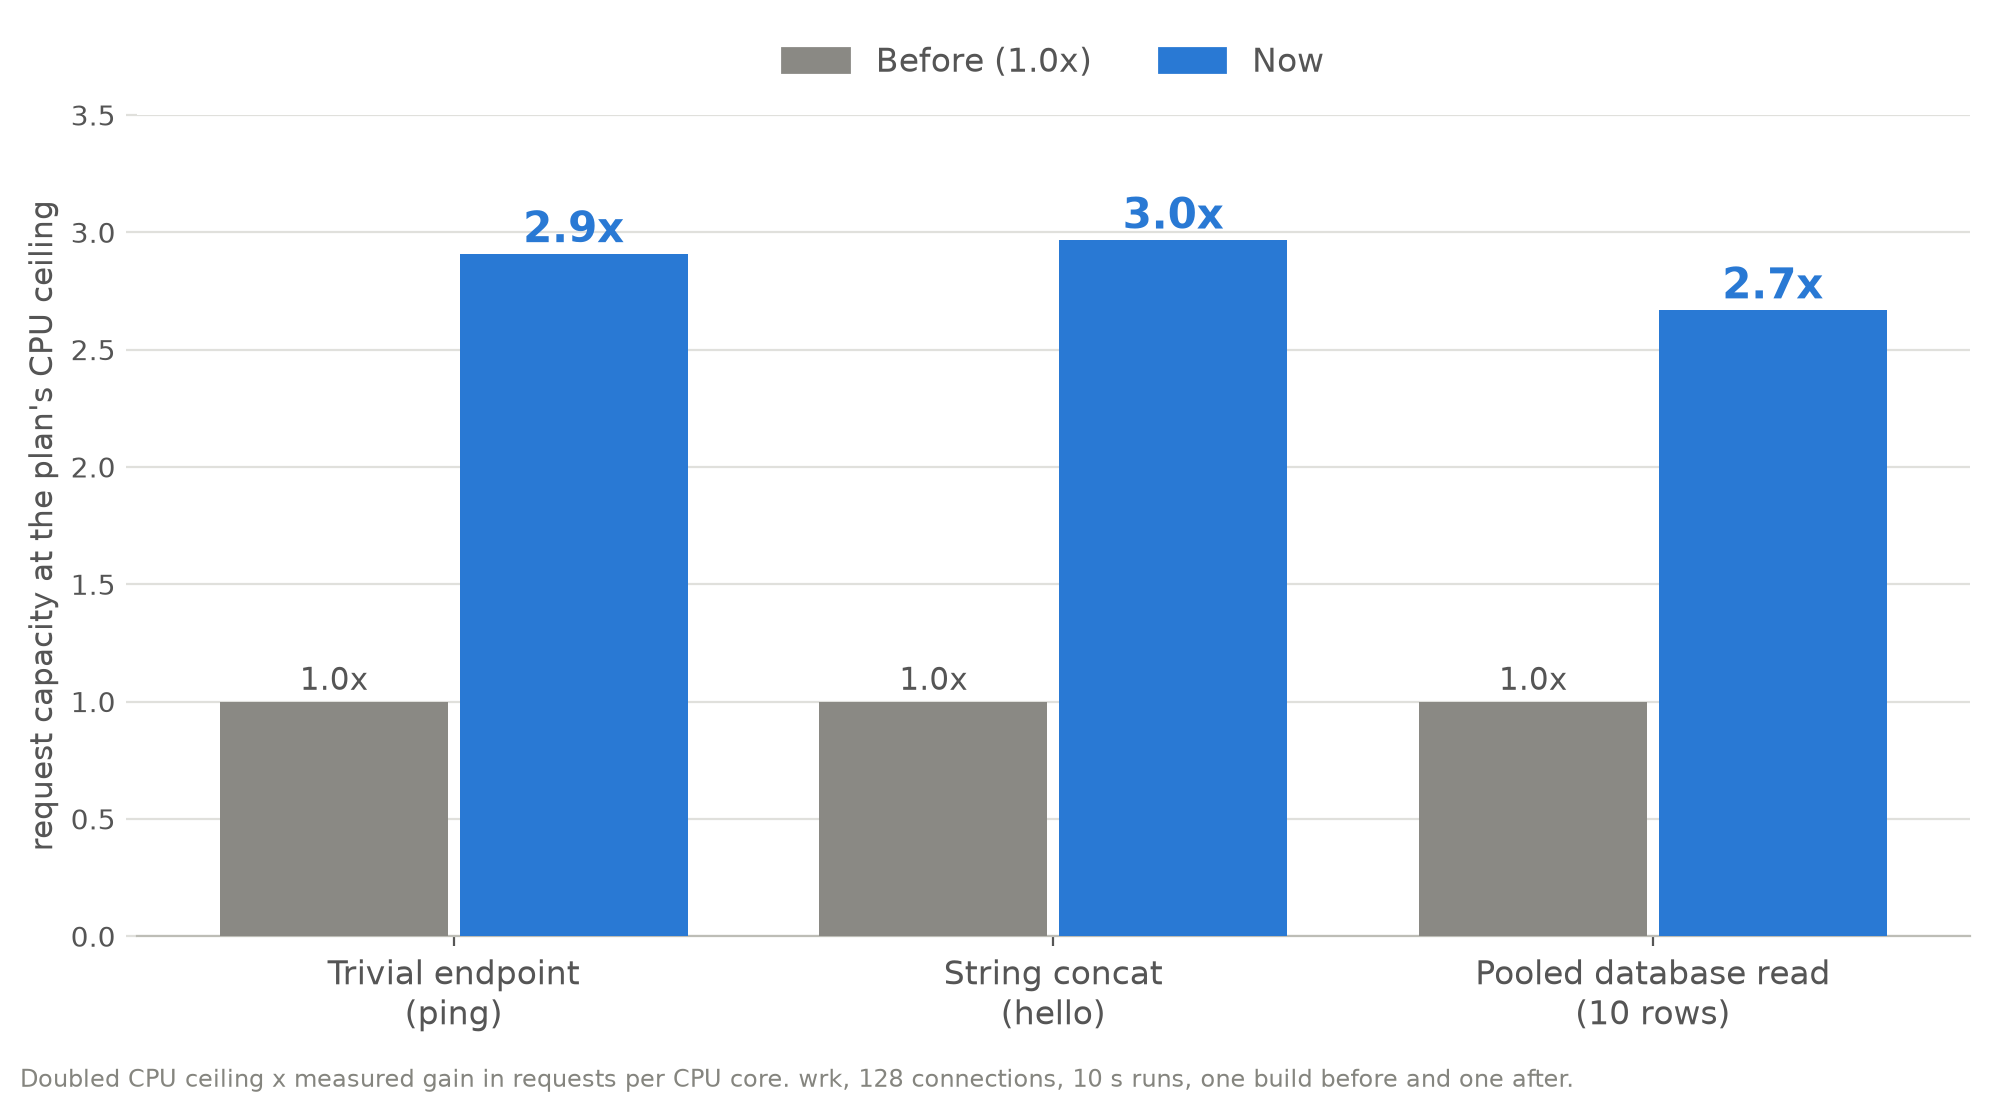
2.9× on a trivial endpoint, 3.0× on string building, 2.7× on a pooled database read. That is the "nearly 3×" in the title.
What we changed
None of this came from one trick. It is a long list of small removals of wasted work, each measured on its own before we kept it.
- A thread hand-off removed from the request path. The part of Magic that dispatches every operation used to hand work to another thread more often than it needed to. Now it doesn't, and every request benefits.
- Endpoints are parsed once. A Hyperlambda endpoint used to be loaded and parsed from disk on every request. Now the parsed form is kept, and the file is checked for changes at most once a second, so an edit shows up almost immediately but ordinary traffic never pays for it.
- Expressions are cached. The engine used to re-parse the same expressions on every evaluation. A bounded cache now remembers recent ones, so the work happens once.
- Website pages assemble from cache. Pages built from templates, and the site configuration they read, are held in memory instead of being rebuilt from files.
- A leaner node tree. Every Hyperlambda program is a tree of nodes, so the tree is the engine's hot path. Nodes that never have children no longer allocate space for them, moving a node's children is a single operation instead of one at a time, and common lookups that used to walk the tree repeatedly now walk it once.
- Our own JSON engine. We replaced a third-party JSON library with one written for exactly this job. It gets its own section below.
- Responses go straight to the wire as bytes. The response body is written directly as UTF-8 with a known length, so responses arrive with a
Content-Lengthinstead of being sent in chunks, and nothing is built as a string only to be converted again. - Request bodies are read once. A JSON request is read into a buffer sized from its declared length and parsed in place.
- API calls to other services parse once. When a cloudlet calls another API and receives JSON, the response is now parsed a single time from the bytes that arrived.
- A tidier start-up. The scan that discovers all of Magic's capabilities when a cloudlet starts skips assemblies that can't contain any.
- 218 dependency updates. Every package Magic depends on moved to its current version.
The commits for the request-path work are public: 27f6711...ffaaac7.
Memory: from about 178 MB to about 78 MB
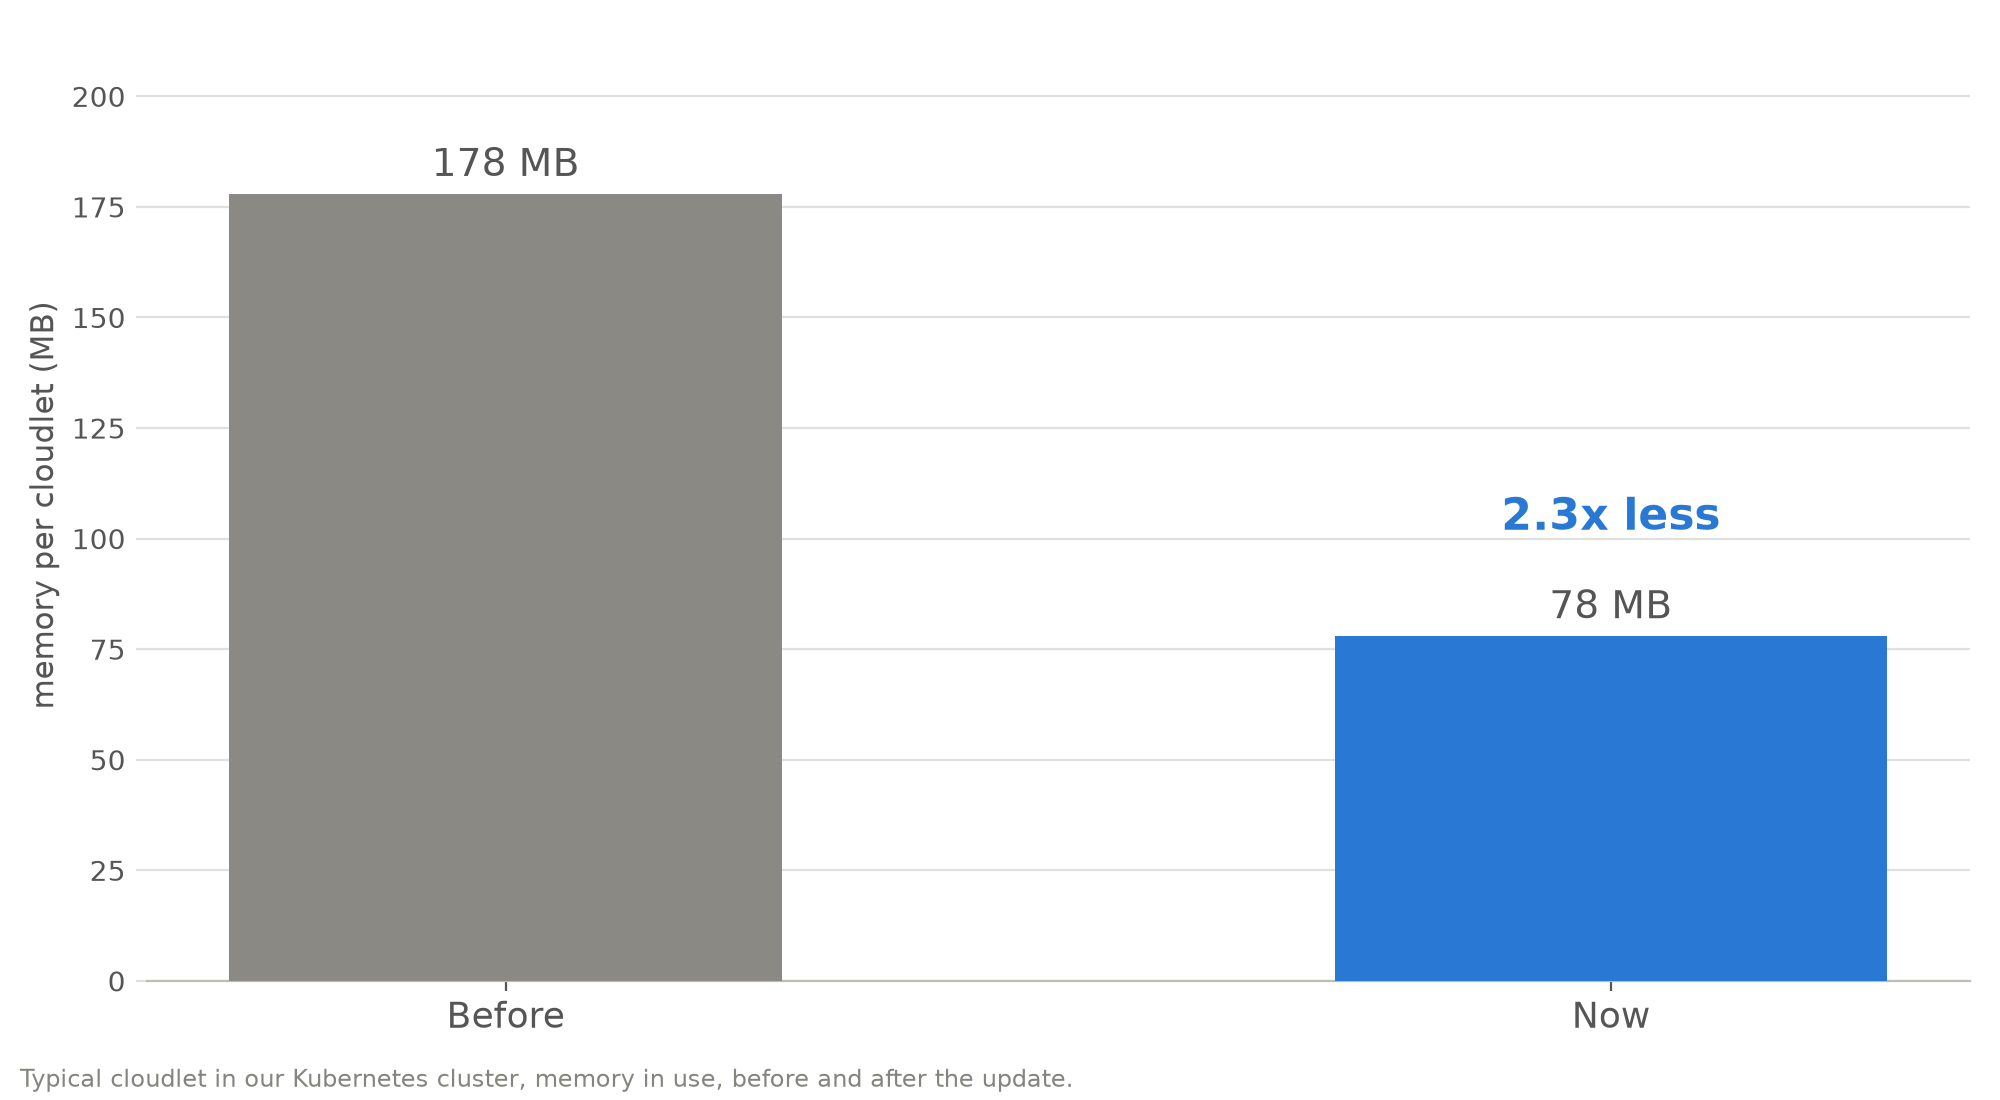
A typical cloudlet in our cluster went from using about 178 MB of memory to about 78 MB, which is 2.3× less. Less memory per cloudlet means more room on every server for every cloudlet, and it is a large part of why we could raise the CPU and storage without raising the price.
And it stays that way under attack. We pointed a "DDoS" at our own cloudlet's health-check endpoint from the local network: roughly 109,000 requests in 30 seconds, about 3,600 requests per second. We watched its memory in Grafana. The dashed line at the top is its 768 MiB limit:
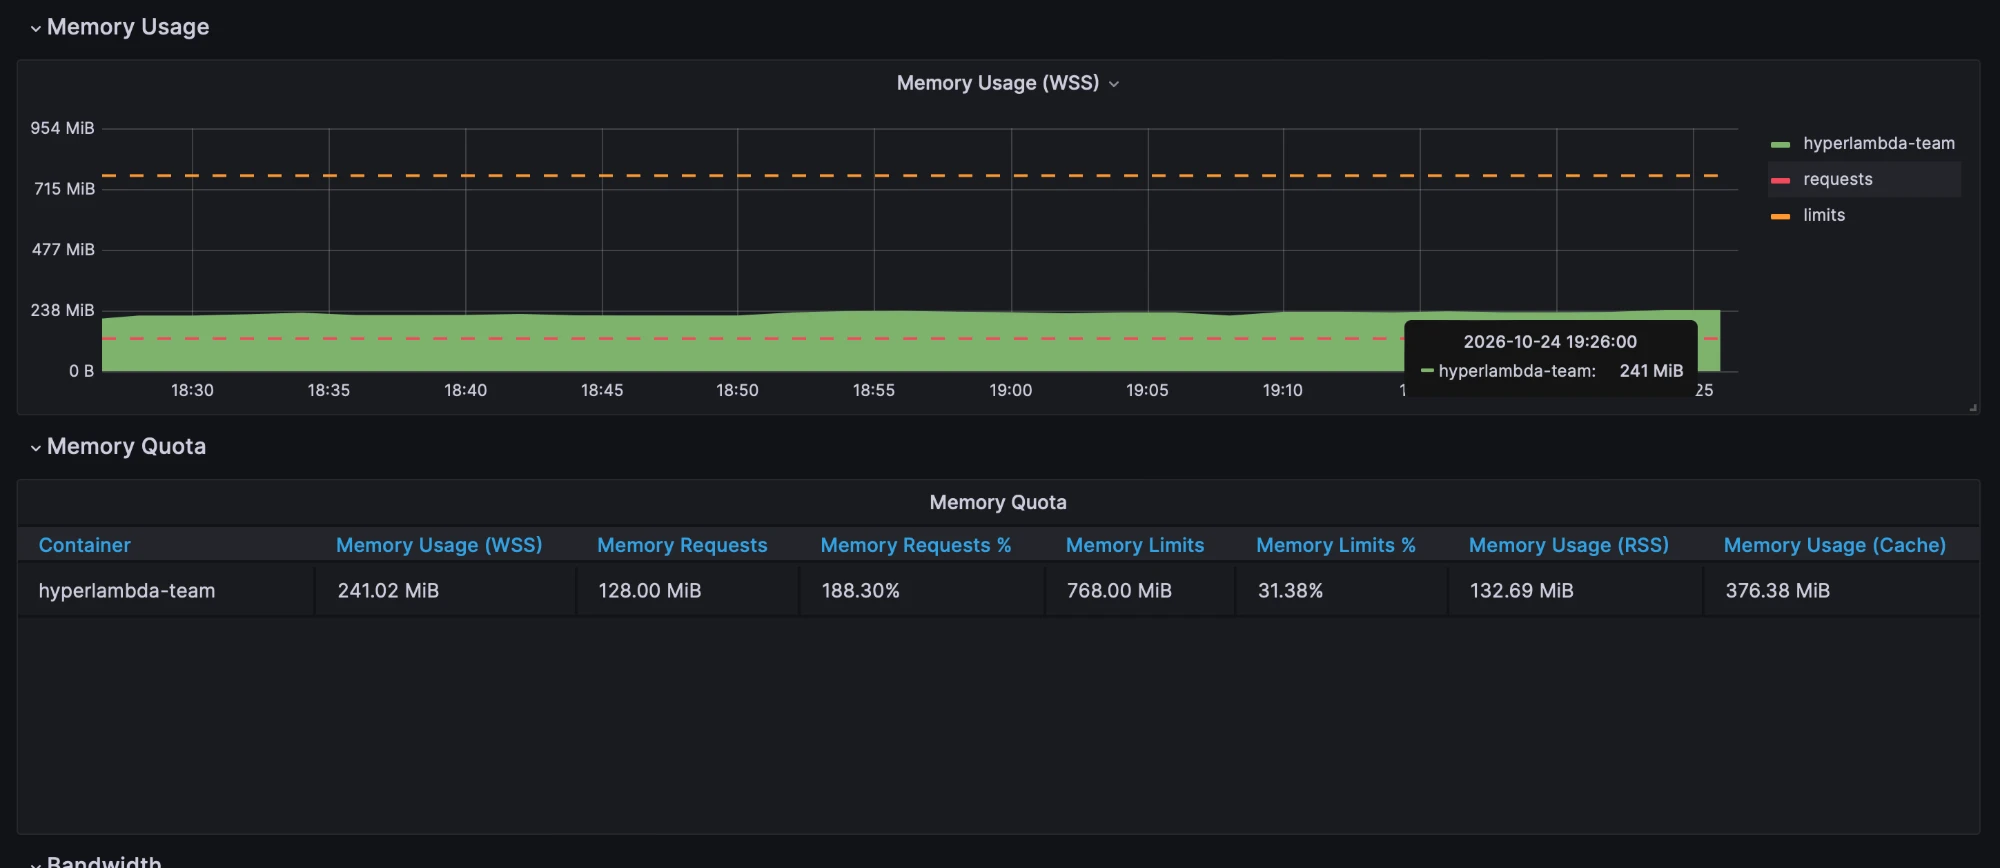
Memory barely moved. The working set stayed flat at about 241 MiB for the whole hour on the chart, which is 31% of the 768 MiB limit, and the resident memory of the process is 133 MiB.
The new JSON engine in numbers
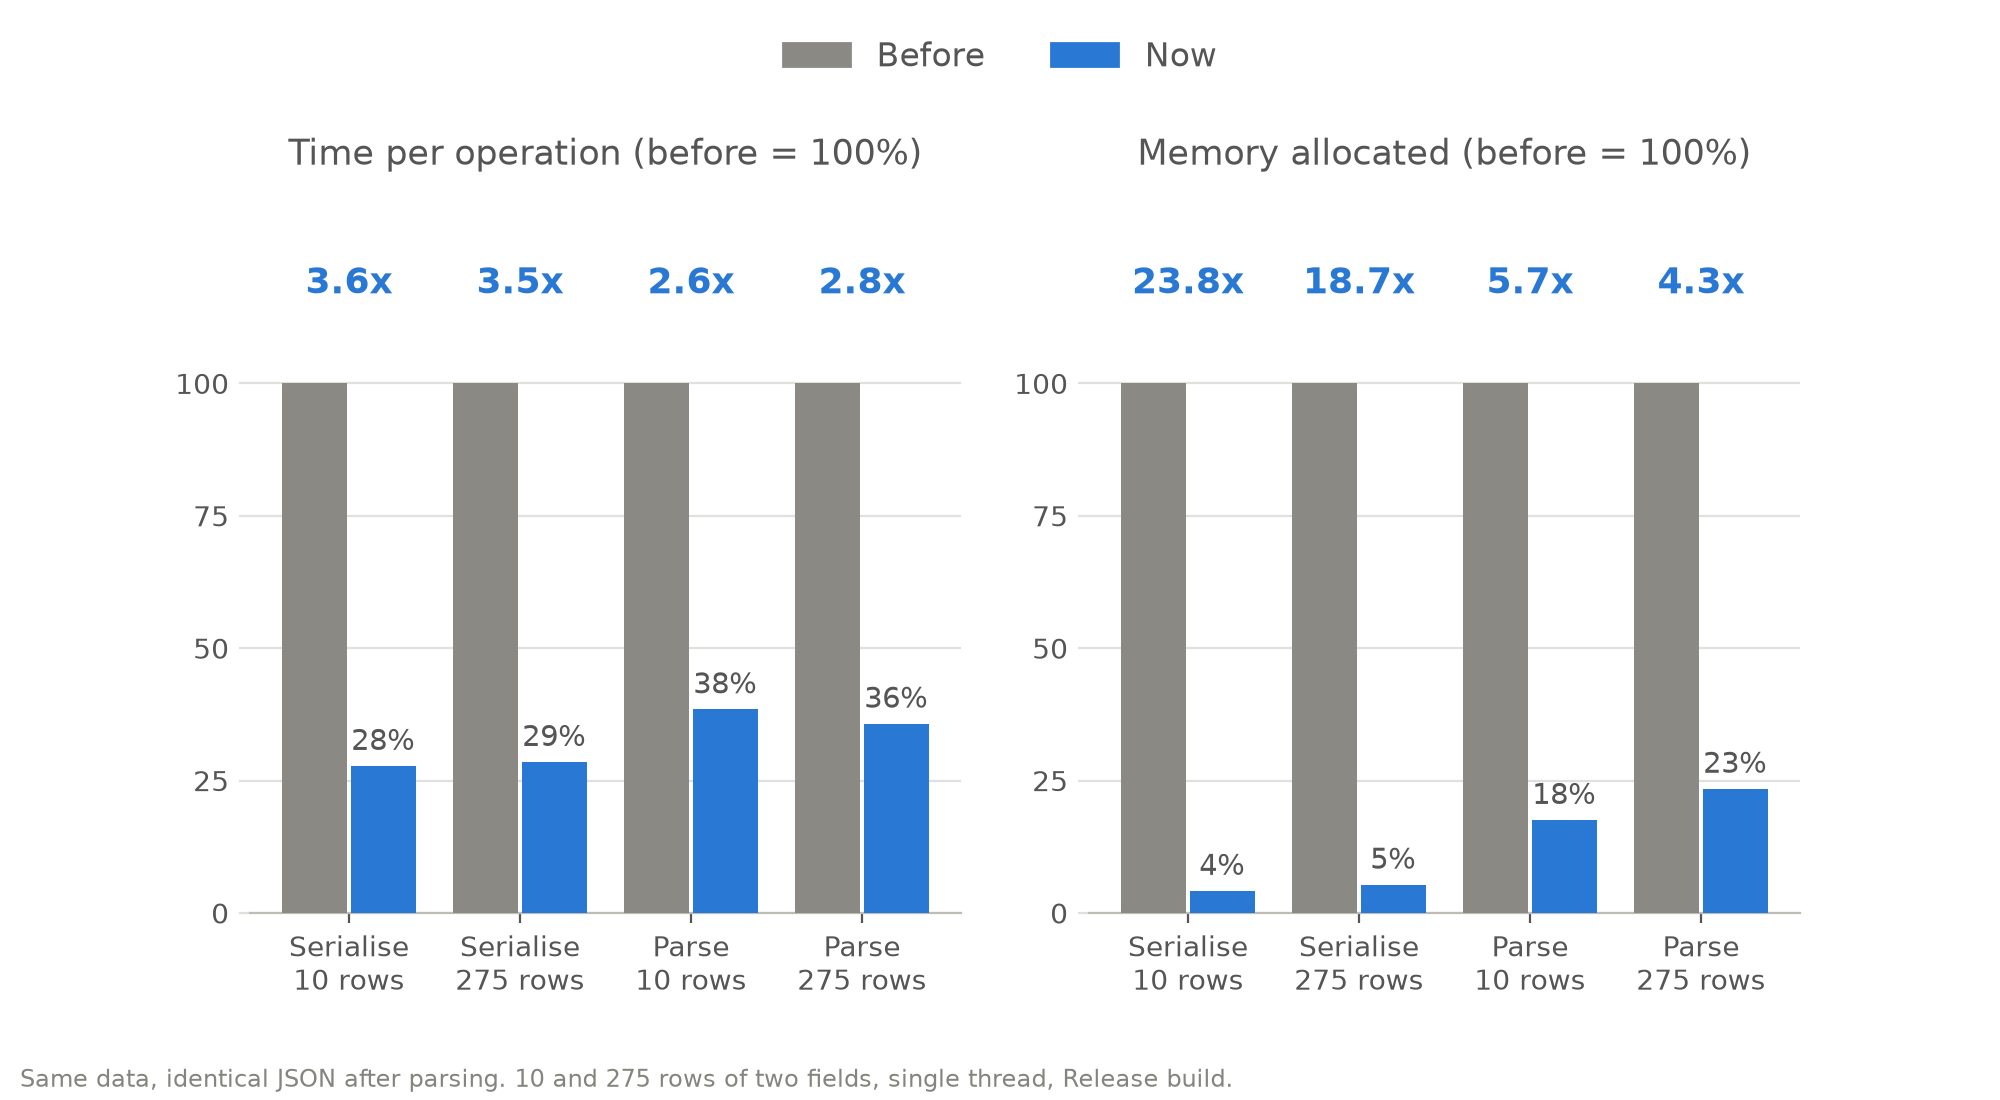
Almost everything a cloudlet does is JSON in, JSON out, so we replaced the library that did it. The new engine reads and writes Magic's own node trees directly, with no intermediate objects in between.
| Operation | Time before | Time now | Speed-up | Memory before | Memory now | Less memory |
|---|---|---|---|---|---|---|
| Write 10 rows | 3.3 µs | 0.9 µs | 3.6× | 17.2 KB | 0.7 KB | 23.8× |
| Write 275 rows | 88.5 µs | 25.2 µs | 3.5× | 346 KB | 18.6 KB | 18.7× |
| Read 10 rows | 4.2 µs | 1.6 µs | 2.6× | 21.2 KB | 3.7 KB | 5.7× |
| Read 275 rows | 117 µs | 41.9 µs | 2.8× | 430 KB | 101 KB | 4.3× |
Your applications don't change. We compared the old and new builds on the same requests, and every response body came back identical; the only difference is the Content-Length header mentioned above. We also compared the new engine against the library it replaced on randomly generated documents, including numbers, dates and unusual characters, before we let it near a cloudlet.
Databases: connection pooling
The biggest single number we found is not code at all. By default, every database call opened and closed its own connection. We switched on SQLite connection pooling on a live cloudlet in our cluster, and ran the same endpoint with the same load from inside the cluster:
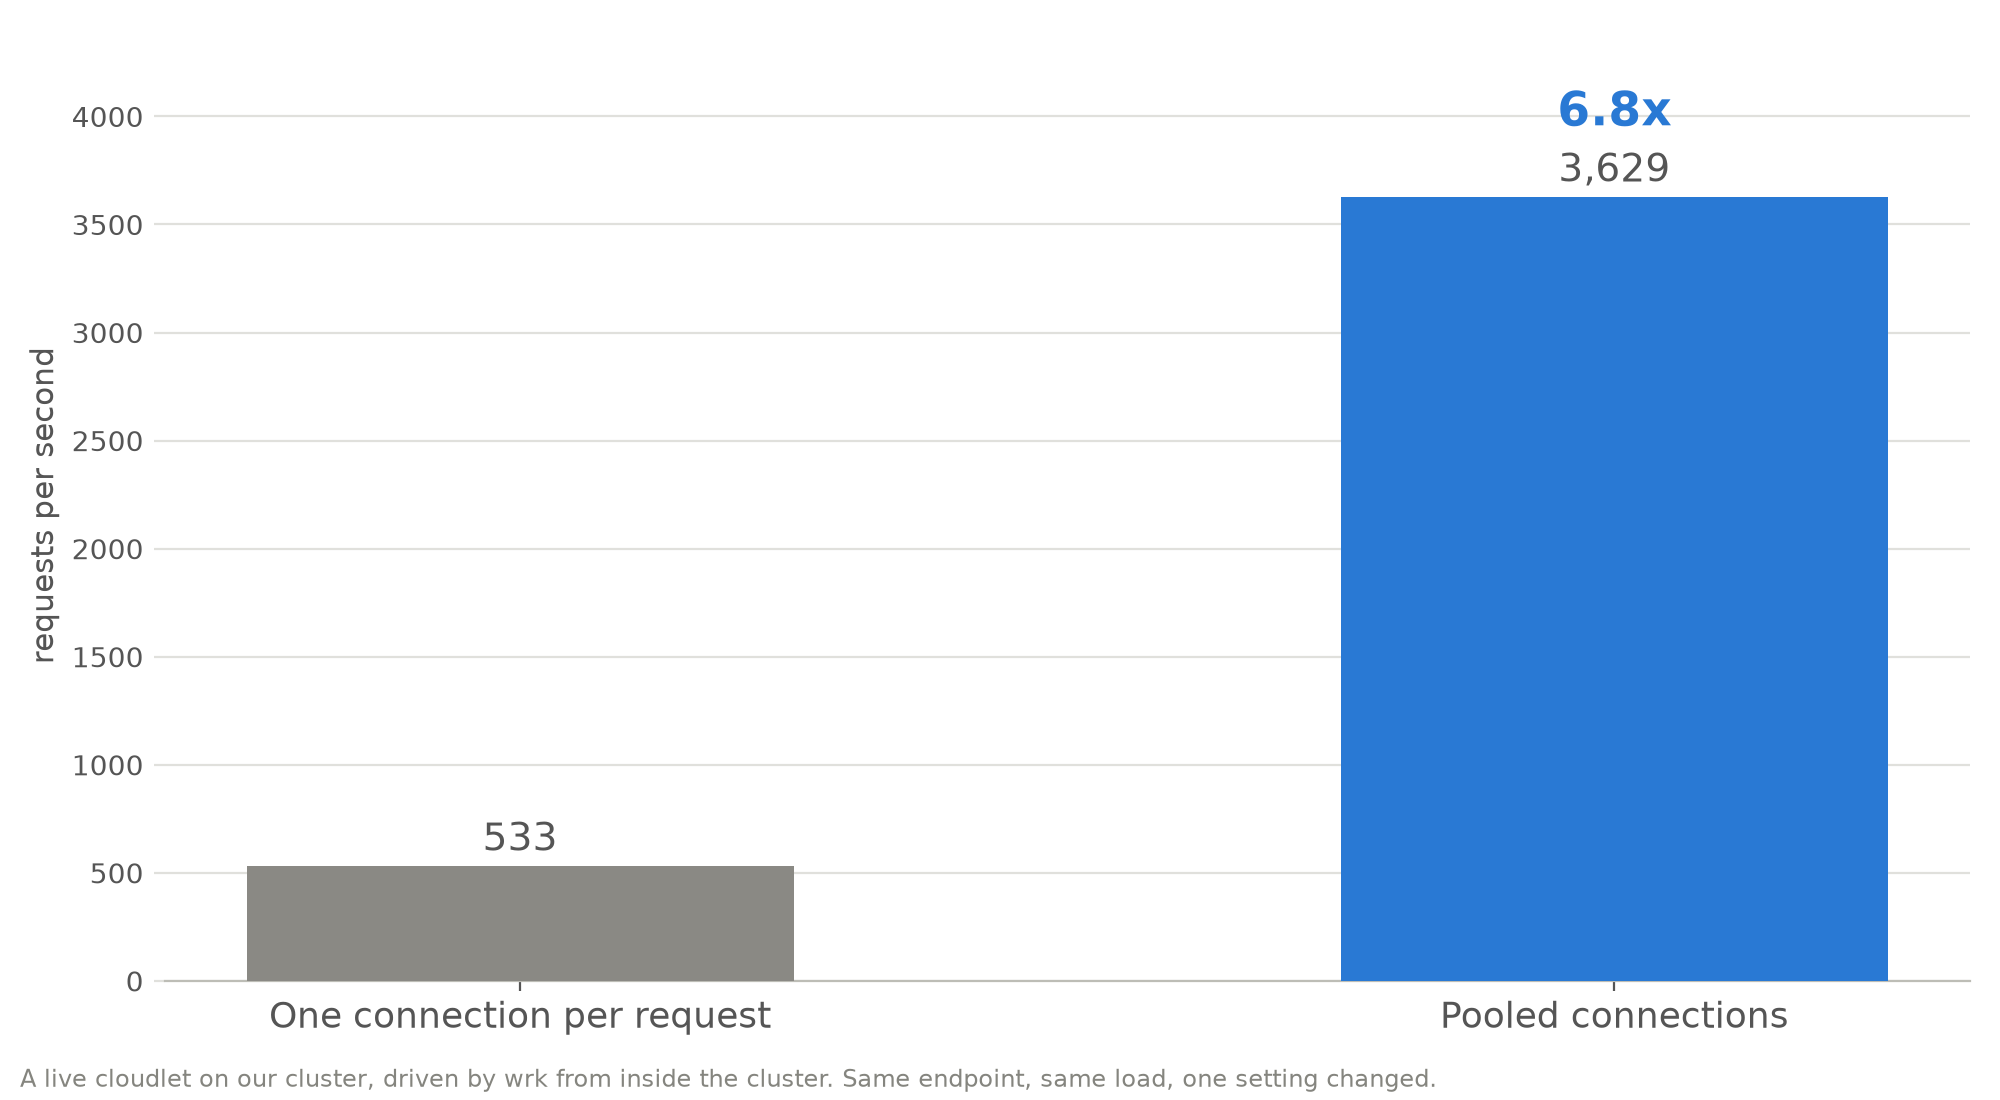
533 requests per second became 3,629: 6.8× more. On a laptop, with a larger machine and a heavier load, the same switch takes a database read from 4,232 to 62,003 requests per second, as measured in our reproducible benchmark. It is one word in the connection settings, and it is the first thing to try on a database-heavy cloudlet.
Storage, and a calmer cloudlet
- Storage grew 5× on Professional (2 GB to 10 GB) and 12.5× on Enterprise (4 GB to 50 GB). Volumes are expanded in place, so there is no migration and your files stay where they are.
- Health checks at every stage. A startup check, a readiness check and a liveness check now watch each cloudlet, so a cloudlet only receives traffic once it is actually ready, and a stuck one is restarted without anyone noticing.
- Updates restart a cloudlet once. Rolling out a new version used to churn through several restarts. It is now one.
- Guaranteed baseline, room to burst. Every cloudlet has a reserved share of CPU and memory, and can burst up to its full ceiling when the machine has spare capacity.
- Every cloudlet is on a dashboard. Memory, CPU and throttling for the whole cluster are watched in Grafana, which is how the chart above was drawn.
How we measured
- Throughput and CPU.
wrk4.2.0 against one URL at 128 connections, with a warm-up thrown away and then 10 seconds measured, on a MacBook Pro with an Apple M3 Pro (11 cores). CPU use is the server's summed CPU time divided by wall-clock time, so 874% means about 8.7 cores busy. - Same everything, twice. The before and after builds are the same Magic with the same configuration, the same database and the same three endpoints, started one at a time. Responses were compared before any measuring started. A second run from scratch agreed with the first within about 5%.
- JSON. A single-threaded microbenchmark in a Release build, comparing the engine we replaced against the new one on the same documents, timing and counting allocated bytes per operation.
- Memory and pooling on cloudlets. Read from our Kubernetes cluster's own metrics, and
wrkrun from a pod inside the cluster. - Full scripts. The reproducible benchmark, with every script, is in the round-two article.
What you need to do
Nothing. Cloudlets are moved to the new sizes as part of the update, and every new cloudlet starts with them, whether you run it yourself on hyperlambda.dev or we manage it for you at ainiro.io. The prices are unchanged, there is no new plan, and the details for self-run cloudlets are on the pricing page.
Frequently asked questions
Did the price of a Magic cloudlet change?
No. On hyperlambda.dev, Professional is $100 a month and Enterprise is $300 a month, as before. On a managed plan from AINIRO, Professional is $298 and Enterprise is $498, as before. Both plans, on both products, got a bigger machine.
How much faster is a cloudlet now?
The engine serves 1.3× to 1.5× more requests per CPU core, and the CPU ceiling doubled on both plans, so a cloudlet can serve between 2.7× and 3.0× the requests it could before. JSON reading and writing is 2.6× to 3.6× faster, and a database-heavy endpoint can be several times faster again with connection pooling.
How much storage does a cloudlet get now?
Professional has 10 GB, up from 2 GB, and Enterprise has 50 GB, up from 4 GB.
Do I have to change my application?
No. Responses are identical to before, apart from carrying a Content-Length header instead of being sent in chunks.